Difference between revisions of "Open Transit Indicators"
m |
(update infobox) |
||
| Line 7: | Line 7: | ||
|license= [[GNU General Public License]] | |license= [[GNU General Public License]] | ||
|documentation= https://github.com/WorldBank-Transport/open-transit-indicators/blob/master/2015_01_20_OTI_UserGuide-rev3.pdf | |documentation= https://github.com/WorldBank-Transport/open-transit-indicators/blob/master/2015_01_20_OTI_UserGuide-rev3.pdf | ||
| + | |data_in= [[GTFS]], GIS shapefiles, TransitTime | ||
| + | |data_out=maps, accesibility and performance statistics | ||
| + | |website= https://github.com/WorldBank-Transport/open-transit-indicators | ||
}} | }} | ||
"The Open Transit Indicators project was developed by the World Bank, in partnership with the Chinese Academy of Transport Science and the Haiphong Department of Transportation (Vietnam). The application uses information about a city’s transit system, along with additional data about demographics, to calculate baseline indicators of transit service quality, such as average distance between transit stops and average service frequency. The service quality indicators can then be used to compare one city’s transit system to those of other cities, identify possibilities for service improvement, and evaluate the effect of hypothetical service changes."<ref>[http://www.azavea.com/blogs/newsletter/v10i1/open-transit-indicators-enable-cities-to-design-better-transit-systems/ Azavea Journal, Derek Dohler in Vol. 10 Issue 1, March 2015]</ref> | "The Open Transit Indicators project was developed by the World Bank, in partnership with the Chinese Academy of Transport Science and the Haiphong Department of Transportation (Vietnam). The application uses information about a city’s transit system, along with additional data about demographics, to calculate baseline indicators of transit service quality, such as average distance between transit stops and average service frequency. The service quality indicators can then be used to compare one city’s transit system to those of other cities, identify possibilities for service improvement, and evaluate the effect of hypothetical service changes."<ref>[http://www.azavea.com/blogs/newsletter/v10i1/open-transit-indicators-enable-cities-to-design-better-transit-systems/ Azavea Journal, Derek Dohler in Vol. 10 Issue 1, March 2015]</ref> | ||
Revision as of 22:32, 6 April 2017
| This page still requires some edits, it has been added to Leeor's edit queue |
| Vendor | World Bank Azavea |
|---|---|
| License | GNU General Public License |
| Documentation | https://github.com/WorldBank-Transport/open-transit-indicators/blob/master/2015_01_20_OTI_UserGuide-rev3.pdf |
| Data Input | GTFS, GIS shapefiles, TransitTime |
| Data Output | maps, accesibility and performance statistics |
| Website | https://github.com/WorldBank-Transport/open-transit-indicators |
"The Open Transit Indicators project was developed by the World Bank, in partnership with the Chinese Academy of Transport Science and the Haiphong Department of Transportation (Vietnam). The application uses information about a city’s transit system, along with additional data about demographics, to calculate baseline indicators of transit service quality, such as average distance between transit stops and average service frequency. The service quality indicators can then be used to compare one city’s transit system to those of other cities, identify possibilities for service improvement, and evaluate the effect of hypothetical service changes."[1]
Screenshots are shown below.
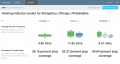
Indicator results comparison
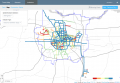
Map of the average distance between stops in Zhengzhou for each bus route
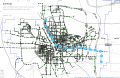
Building a possible scenario in Zhengzhou

Source code is at github.com/WorldBank-Transport/open-transit-indicators