Uploads by Rabiabonour
Jump to navigation
Jump to search
This special page shows all uploaded files.
| Date | Name | Thumbnail | Size | Description | Versions |
|---|---|---|---|---|---|
| 22:48, 10 March 2017 | Oregontrail.jpg (file) |  |
1.04 MB | Fully separated paths are the safest places to walk and bike and are the most family-friendly. Source: [https://commons.wikimedia.org/wiki/File:Oregon_solar-street-lighting_project.jpg Greenshire New Energy] | 1 |
| 22:39, 10 March 2017 | Schoolbikes.jpg (file) |  |
7.32 MB | Bicycle parking is a cheap way to encourage active trips to school. Source: [https://www.flickr.com/photos/jamesbondsv/8549758414 Steven Vance] | 1 |
| 21:54, 5 March 2017 | TriMetapp.jpg (file) |  |
39 KB | TriMet is using MOD Sandbox grant funds to integrate shared mobility into its trip planning app. Source: [https://www.transit.dot.gov/research-innovation/mobility-demand-mod-sandbox-program.html Federal Transit Administration] | 1 |
| 00:25, 25 February 2017 | Scoop.jpeg (file) |  |
75 KB | Scoop's BART integration hopes to encourage carpooling to transit. Source: [https://blog.takescoop.com/carpool-to-bart-59d8555e79a2#.qxhusnw9p Scoop] | 1 |
| 22:53, 14 February 2017 | Distracteddriving.jpg (file) |  |
66 KB | Preventing operator inattention is a major concern for transit agencies. Source: [https://commons.wikimedia.org/wiki/File:I-55_I-40_West_Memphis_AR_distracted_driving_warning_sign.jpg Thomas R. Machnitzki] | 1 |
| 22:23, 12 February 2017 | Orangelinebrt.jpg (file) |  |
540 KB | LA's Orange Line BRT carries more than 22,000 passengers each day. Source: [https://flic.kr/p/5t7W2a Metro Library and Archive] | 1 |
| 21:25, 12 February 2017 | Hotlane.jpg (file) |  |
1.98 MB | High-occupancy toll lanes are one form of congestion pricing seen in the US. Source: [https://commons.wikimedia.org/w/index.php?curid=47400327 Famartin (CC BY-SA 4.0)] | 1 |
| 19:08, 10 February 2017 | Denverrtd.jpg (file) |  |
444 KB | Denver RTD was one of the first agencies to experiment with a DDGP program. Source: [https://www.flickr.com/photos/37467370@N08/7582314732/ Greg Goebel] | 1 |
| 21:37, 7 February 2017 | Busad.jpg (file) |  |
363 KB | Many transit agencies use advertising on vehicles as an additional source of revenue. Source: [https://commons.wikimedia.org/wiki/File:LACMTA_Metro_Local_Neoplan_AN440A_6572.jpg George Lumbreras] | 1 |
| 17:55, 4 February 2017 | Connectoralliance.jpg (file) |  |
174 KB | The five agencies in Oregon's CONNECTOR Alliance operate autonomously, but coordinate stops and schedules to make trip planning easier for riders. Source: [www.nworegontransit.org CONNECTOR Alliance] | 1 |
| 17:48, 4 February 2017 | Orca.jpg (file) |  |
597 KB | Puget Sound's ORCA integrated fare card is one example of the many ways transit agencies can coordinate. Source: [https://www.flickr.com/photos/viriyincy/5559258691 Oran Viriyinci] | 1 |
| 22:39, 22 January 2017 | Cngbus.jpg (file) |  |
812 KB | A CNG-powered [https://www.octa.net/ Orange County Transportation Authority] bus. Source: [https://commons.wikimedia.org/wiki/File:NABI_40.09_LFW_bus_OCTA.jpg Matthew Jude Brown, Wikimedia Commons] | 1 |
| 19:35, 14 January 2017 | Abandonedbike.jpg (file) |  |
194 KB | An example of tags used to mark abandoned bicycles to be removed. Source: [https://phillymotu.wordpress.com/2013/06/20/help-us-locate-abandoned-bicycles/ Philadelphia Mayor's Office of Transportation and Utilities] | 1 |
| 19:27, 14 January 2017 | Hugebikeparking.jpg (file) |  |
5.61 MB | A large bike parking structure in Amsterdam. Source: [https://www.flickr.com/photos/crystiancruz/2354270678 Crystian Cruz] | 1 |
| 19:56, 13 January 2017 | Bikelocker.jpg (file) |  |
997 KB | LA Metro has bike lockers available for long-term rental at stations. Source: [https://www.flickr.com/photos/viriyincy/8926971973 Oran Viriyinci] | 1 |
| 19:28, 13 January 2017 | Stackedparking.jpg (file) |  |
129 KB | Stacked bicycle parking at a Southern Railway station in Sutton, England. Source: [http://www.southernrailway.com/southern/news/news-archive/2011/07/sutton-station-gets-double-deck-cycle-parking/ Southern Railway] | 1 |
| 23:55, 4 January 2017 | Sbs2.jpg (file) |  |
1.63 MB | New York City's Select Bus Service uses off-board fare collection to speed up boarding. Source: https://www.flickr.com/photos/mtaphotos/10930770364 MTA] | 1 |
| 23:52, 4 January 2017 | Sbsticket.jpg (file) |  |
247 KB | New York City's Select Bus Service uses off-board fare collection to speed up boarding. Source: https://commons.wikimedia.org/wiki/File:Select_Bus_Service_ticket_machine.jpg GK tramrunner229] | 1 |
| 23:49, 4 January 2017 | Centerlane.jpg (file) |  |
1.24 MB | An example of a median bus lane in Brazil. Source: [https://commons.wikimedia.org/wiki/File:Curitiba_04_2006_04_RIT.jpg Mario Roberto Duran Ortiz] | 1 |
| 23:46, 4 January 2017 | Bustraffic.jpg (file) |  |
2.26 MB | Operating in general travel lanes, buses run a significant risk of getting caught in traffic. Source: [https://commons.wikimedia.org/wiki/File:Traffic_in_Brasilia_before_Brazil_%26_North_Korea_match_at_World_Cup_2010-06-15_1.jpg Wilson Dias/ABr] | 1 |
| 23:38, 4 January 2017 | Bussignal.jpg (file) |  |
172 KB | An example of a bus-only traffic signal. | 1 |
| 20:14, 29 December 2016 | Tbest.jpg (file) |  |
674 KB | An example of the land use analysis possible within TBEST. Source: [http://tbest.org/wp-content/files/TBEST_TRB_Applications_Conference-_may_2015.pdf Center for Urban Transportation Research] | 1 |
| 20:33, 19 December 2016 | LAP1.jpg (file) |  |
934 KB | An example of the Location Affordability Index results for Redding, CA. Source: [http://www.locationaffordability.info/default.aspx Location Affordability Portal] | 1 |
| 19:11, 17 December 2016 | Ftis2.jpg (file) |  |
430 KB | A partial example of a report generated by iNTD. Source: [http://www.ftis.org/ FTIS] | 1 |
| 19:08, 17 December 2016 | Ftis1.jpg (file) |  |
862 KB | iNTD lets users search NTD data using a simple interface. Source: [http://www.ftis.org/ FTIS] | 1 |
| 22:03, 2 December 2016 | Muni.jpg (file) |  |
337 KB | Muni was the victim of a ransomware cyberattack in November, 2016. Source: [https://commons.wikimedia.org/wiki/File:MUNI-N-San-Francisco-1.jpg Zboralski, Wikimedia Commons]. | 1 |
| 22:21, 29 November 2016 | Trimetresponse.jpg (file) |  |
305 KB | TriMet developed a flowchart guiding staff on how to deal with web-based feedback. Source: [http://www.trb.org/Main/Blurbs/172697.aspx Transit Cooperative Review Program] | 1 |
| 22:14, 29 November 2016 | Webfeedback.jpeg (file) |  |
574 KB | Digital tools are increasingly important for transit agencies looking to connect with riders. Source: [https://www.pexels.com/photo/man-in-brown-hoodie-standing-in-front-of-train-railway-211052/ Clem Onojeghuo] | 1 |
| 22:06, 29 November 2016 | Socialmedia.png (file) |  |
164 KB | Transit agencies have an increasing number of social media platforms they can use to connect with riders. Source: [https://commons.wikimedia.org/wiki/File:Socialmedia-pm.png Ibrahim.Id, Wikimedia Commons] | 1 |
| 19:32, 28 November 2016 | Busrepair.jpg (file) |  |
2.87 MB | Bus maintenance is an important part of a transit agency's operations. Source: [https://www.flickr.com/photos/kecko/1533470077 Kecko] | 1 |
| 19:18, 26 November 2016 | Maintenancestaffing.jpg (file) |  |
611 KB | An example of a completed Results - Staffing Sufficiency sheet. Source: [http://www.trb.org/Publications/Blurbs/173927.aspx Maintenance Staffing Calculator] | 1 |
| 23:17, 25 November 2016 | Lifecycle.jpg (file) |  |
245 KB | Stages of the lifecycle management process. Source: [https://www.transit.dot.gov/regulations-and-guidance/asset-management/asset-management-guide-small-providers-fta-report-no0092 Federal Transit Administration] | 1 |
| 22:00, 24 November 2016 | Metroyard.jpg (file) |  |
641 KB | While large agencies have extension maintenance budgets, smaller ones have to be more strategic in their asset management. Soure: [https://www.flickr.com/photos/metrolibraryarchive/24521302370/ Alan Weeks, Metro Library and Archive. | 1 |
| 20:50, 20 November 2016 | Transitlanduse.jpg (file) | 448 KB | Successfully linking transit and land use can have a variety of benefits for a community. Source: [http://www.trb.org/Publications/Blurbs/173473.aspx Transit Cooperative Research Program] | 1 | |
| 19:42, 20 November 2016 | Portlandstreetcar.jpg (file) |  |
2.77 MB | Smart long-range planning by TriMet created an environment receptive to the establishment of the Portland streetcar. Source: [https://www.flickr.com/photos/31246066@N04/6456117565 Ian Sane] | 1 |
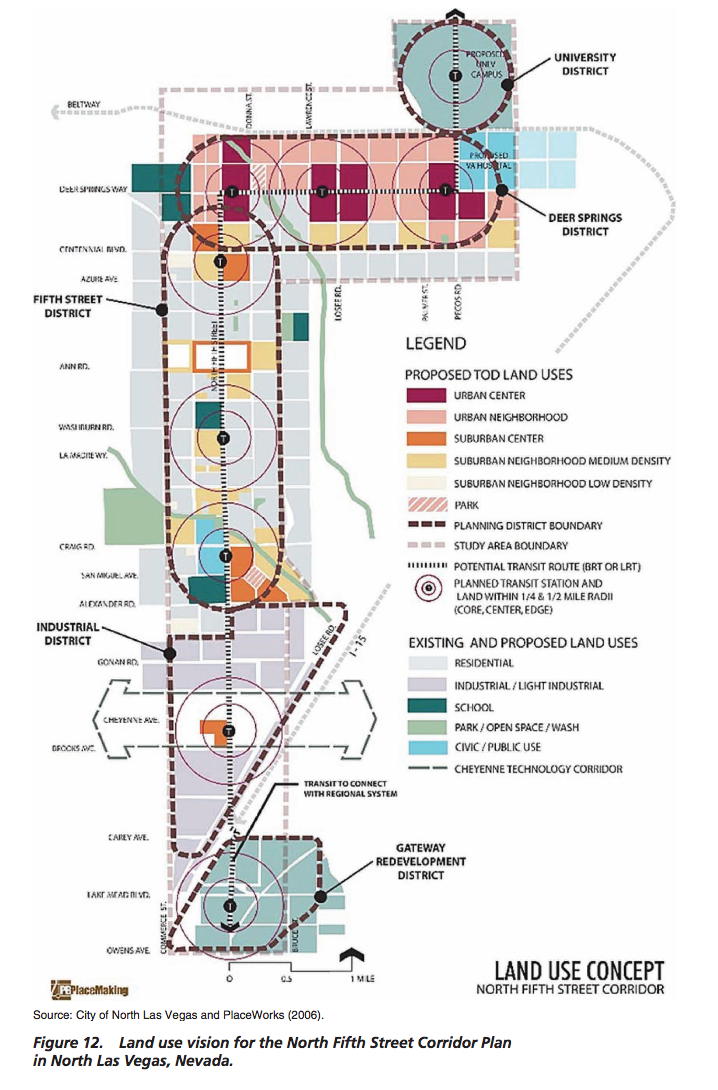
| 22:49, 11 November 2016 | Livabilityvision.png (file) |  |
783 KB | This land use diagram for Las Vegas's North Fifth Street Corridor Plan is an example of the type of document that can be developed during the visioning process. Source: [http://www.trb.org/Publications/Blurbs/174953.aspx Transit Cooperative Research Bo... | 1 |
| 22:26, 11 November 2016 | Expocorridor.jpg (file) |  |
630 KB | Development along Los Angeles's Expo Line corridor. Source: [https://www.flickr.com/photos/metrolibraryarchive/25422066816/ Alan Weeks, Metro Library and Archive] | 1 |
| 20:56, 11 November 2016 | Uberlyft.jpg (file) |  |
848 KB | Shared mobility providers like ridesourcing companies Uber and Lyft are becoming an increasingly large part of California's transportation system. Source: [https://www.flickr.com/photos/nrkbeta/25511816003 Ståle Grut / NRKbeta.no] | 1 |
| 20:42, 11 November 2016 | Bridjkc.jpg (file) |  |
224 KB | An example of the vehicles being used for the KCATA/Bridj partnership. Source: [https://media.ford.com/content/fordmedia/fna/us/en/news/2016/02/11/bridj-kansas-city-ford-urban-mobility.html Ford] | 1 |
| 23:51, 8 November 2016 | LTCgraph.jpg (file) |  |
40 KB | The Transit Corridor Livability Calculator's Livability Performance Graph compares user-selected characteristics against each of the corridor types. Source: [http://www.trb.org/Publications/Blurbs/174953.aspx Transit Cooperative Research Program] | 1 |
| 19:04, 5 November 2016 | Alltransitrank.jpg (file) | 202 KB | AllTransit Performance Score top-ten rankings for California municipalities with populations larger than 250,000 people. Source: [http://alltransit.cnt.org/rankings/ AllTransit] | 1 | |
| 18:57, 5 November 2016 | Alltransit.jpg (file) | 2.02 MB | AllTransit's map interface compares areas in a city in terms of individual metrics. Source: [http://alltransit.cnt.org/metrics/ AllTransit] | 1 | |
| 04:10, 2 November 2016 | RemixJane.png (file) |  |
1.57 MB | When using Jane, the white circles show how far a rider can travel in a specific timeframe. Source: [https://www.remix.com/ Remix] | 1 |
| 04:08, 2 November 2016 | Remix1.png (file) |  |
1.56 MB | Remix makes it easy to draw a line and see schedule and cost information. Source: [https://www.remix.com/ Remix] | 1 |
| 19:21, 21 October 2016 | HTIndexMethodology.jpg (file) |  |
462 KB | The H+T Index was created by performing a regression analysis of the relationship between neighborhood characteristics and transportation habits. Source: [http://htaindex.cnt.org/about/ Housing and Transportation Affordability Index] | 1 |
| 19:11, 21 October 2016 | HTIndexInUse.jpg (file) |  |
1.06 MB | H+T Index data is presented on a color-coded map. Source: [http://htaindex.cnt.org/map/ Housing and Transportation Affordability Index] | 1 |
| 02:12, 13 October 2016 | Greentrip2.jpg (file) |  |
429 KB | A rendering of a GreenTRIP certified project in San Francisco. Source: [http://www.transformca.org/1532Harrison TransForm] | 1 |
| 00:22, 8 October 2016 | Greentrip1.jpg (file) |  |
523 KB | The dashboard that GreenTRIP Connect uses to display projections. Source: [http://connect.greentrip.org/map-tool.php GreenTRIP Connect] | 1 |
| 18:21, 7 October 2016 | TODdatabase1.jpg (file) |  |
1.95 MB | An example of [http://toddata.cnt.org/db_tool.php TOD Database] in use. | 1 |
| 18:13, 7 October 2016 | Toddatabase2.png (file) |  |
13 KB | A chart illustrating the multiple station geographies. Source: [http://toddata.cnt.org/chapter4.php TOD Database User Guide] | 1 |