Open Transit Indicators
| Vendor | World Bank Azavea |
|---|---|
| License | GNU General Public License |
| Documentation | https://github.com/WorldBank-Transport/open-transit-indicators/blob/master/2015_01_20_OTI_UserGuide-rev3.pdf |
| Data Input | GTFS, GIS shapefiles, TransitTime, OpenStreetMap |
| Data Output | maps, accesibility and performance statistics |
| Website | https://github.com/WorldBank-Transport/open-transit-indicators |
Open Transit Indicators (OTI) is a tool offered by the World Bank that allows public transit administrator measure performance and accessibility of their systems, quickly and easily sketch in new lines to adjust a transit system, and visualize side by side comparisons of the performance and accessibility of the base case and the scenario. The user can specify a broad population category (ex. total population, working age population, school age population), a population subsection (ex. low-income, race, etc.), and a destination (ex. jobs, school, medical centers).
Indicators
The following indicators are available through OTI [1]

Source: https://github.com/WorldBank-Transport/open-transit-indicators/blob/master/2015_01_20_OTI_UserGuide-rev3.pdf

Source: https://github.com/WorldBank-Transport/open-transit-indicators/blob/master/2015_01_20_OTI_UserGuide-rev3.pdf
| Indicator Name | Description |
|---|---|
| Affordability | The ratio of one month of round-trip commuting to one month of poverty-line income. If a = average one-way fare and i = yearly poverty-line income, affordability = (a*42) / (i/12). (The data used by this indicator is input by the user, not pulled from GTFS.) |
| Average Service Frequency | How often a vehicle will arrive at a particular stop for a particular route. |
| Distance Between Stops | The average distance between stops, per route and mode. |
| Length | The sum of the total length of each route in the transit system. This indicator does not account for road or rail shared by multiple routes. |
| Number of Modes | Total number of different transit modes in the system. |
| Number of Routes | Total number of routes in the system. |
| Number of Stops | Total number of stops in the system. Stops shared by multiple routes are counted only once. |
| Stop Density | The number of stops per kilometer of a route. |
| System Road Coverage | The ratio of transit system length to the length of the road network. This indicator accounts for multiple routes sharing the same roadway. |
| Time Traveled Between Stops | Average amount of time traveled between subsequent stops along a route trip. |
| Weekly Number of Hours of Service | The number of hours per week that the system provides service. |
| Network Density | An index value: the total length of the transit network in comparison to the total area of the urban area. |
| Ratio of Suburban Lines | The ratio of lines operating outside the urban area to the lines operating only within the urban area (based on urban boundary data provided under the Settings tab). |
| System Stop Coverage | The percent of the urban area that is within the configured distance from stop locations. |
| Job Accessibility | The number of jobs vs. the number of individuals who can reach a job location (destination metric) within the configured commute time. |
| Population-weighted Service Frequency | Average service frequency adjusted by the number of individuals within the configured distance from stops. More frequent service in areas of high population would result in a higher metric. |
| Population-weighted Service Frequency (2) | Population-adjusted service frequency for the secondary population attribute. |
| System Accessibility | The percentage of the population metric 1 that is within the configured distance from stops. |
| System Accessibility (2) | The percentage of the population metric 2 that is within the configured distance from stops. |
| Dwell Time Variance | The average variance in minutes of dwell time (requires observed stop times). |
| On Time Performance Variance | The average variance in minutes of arrival time (requires observed stop times). |
| Regularity of Headways | The average variance in minutes of headways (requires observed stop times, which come from the uploaded GTFS data). |
Scenario Building and Route Editing

Source: https://github.com/WorldBank-Transport/open-transit-indicators/blob/master/2015_01_20_OTI_UserGuide-rev3.pdf
Open Transit Indicators has a scenario building that allows a user to sketch in a new transit route or to edit an existing transit route. This includes adding, removing, and modifying stops. The application allows for elements to be sketched in and also lets the user edit attributes.
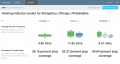
Indicator results comparison
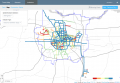
Map of the average distance between stops in Zhengzhou for each bus route
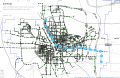
Building a possible scenario in Zhengzhou

References
- ↑ Open Transit Indicators End Users’ Guide. rev 3: 20 January 2015. https://github.com/WorldBank-Transport/open-transit-indicators/blob/master/2015_01_20_OTI_UserGuide-rev3.pdf